

Best project timeline software for 2024 road tested
Paolo Bongiovanni20 Oct 23
Table of contents
In this article we explore how six different project timeline software tools cope in three different moments of a project:
- Creating the initial project timeline.
- Presenting the initial project timeline to the client.
- Preparing the weekly project status report for the client, a few weeks after the project start.
We look at four different types of project timeline tools:
- a spreadsheet based solution, which is what many of us end up using if nothing else is available to us.
- a software tool that specialises in project timelines.
- project management tools that do Gantt charts and task management.
- task/work management tools that offer project timeline features.
📝 Conflict of interest disclosure: we are the creators of the project timeline tool Mindiply Timeline, so we may have some rose-tinted glasses when talking about it. We still tried to be as objective as possible.
The six project timeline software tools under test
Mindiply Timeline
A project management tool focused on project timelines.

Google sheets
A spreadsheet, the swiss knife tool of knowledge workers.

Monday.com
A work management tool that offers Gantt and Timeline views.

ClickUp
Another work management tool that offers Gantt and Timeline views.

GanttPro
A Gantt chart based project management tool that also does task management.

TeamGantt
Another Gantt chart based project management tool that also does task management.

The scenario project - a digital marketing client project
All the project timeline software under review is examined against the same scenario project.
A company called Proppo produces theatre props. They are a well established firm that sells both to local theatres and abroad.
They have approached the digital marketing agency we are working for because, in the last year, online sales have more than halved. The customer realised their online presence is not good enough compared to their competitors, and they have come to our agency for help.
A first short project analysed the current situation. The direct competitors have invested some money in their digital presence, and as a result, Proppo rarely appears in the first results page of relevant internet searches.
They have just approved a project that will reset their online presence: relaunch their website, a content strategy based on a new company blog related to the theatre production industry, and also an online shop using one of the e-commerce platforms already available.
The project runs for six months, between October 2023 and March 2024.
Creating the project timeline
In creating the project timeline we want to know:
- How easy and fast is it to create the project timeline?
- How does the project timeline look?
- Can I show milestones and project dependencies?
- How deep can I break the project down?
We summarise here each project timeline tool capability against these factors, before having an in depth look.
| Tool | Timeline creation speed | Timeline looks | Milestones support | Project dependencies support | breakdown level |
|---|---|---|---|---|---|
| Mindiply Timeline | 🚀 Fast | 🎀 Pretty | ✅ | ✅ | 3 |
| Google Sheets | 🚅 Swift | Just ok | ❌ | ❌ | 2 or 3 |
| Monday.com | 🐢 Slow | 🎀 Pretty | ✅ | ❌ | 2 |
| Clickup | 🐢 Slow | Fine | ❌ | ✅ | 2 |
| GanttPro | 🚀 Fast | 🎀 Pretty | ✅ | ✅ | Unlimited |
| TeamGantt | 🚀 Fast | 🎀 Pretty | ✅ | ✅ | Unlimited |
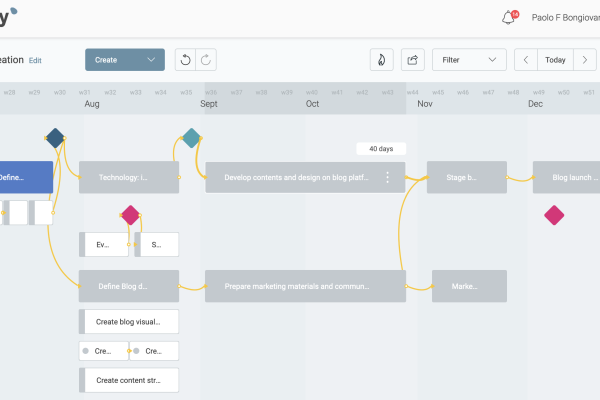
Creating the project timeline with Mindiply Timeline

Mindiply Timeline is a graphical tool. Every element of the project timeline is created within the graphical timeline view, relying heavily on drag & drop.
This is the project timeline tool we are most familiar with - given we crafted it - so it took us the shortest time to create the project timeline (it would be worrying if that wasn't the case). If you are used to visual interfaces like mind maps, electronic whiteboards or Kanban boards, you will swiftly be productive.
Mindiply Timeline can break the project down to three levels of depth, and it can show milestones and project dependencies.
Creating the project timeline with Google Sheets

The timeline feature in Google Sheets is fairly new in October 2023. As long as you have two columns with dates, representing start and end of a date range, you can create a Timeline graph.
Of the project timeline tools we are testing, this is the one that has the least support for things that are not blocks of time. If you want to represent milestones, you can use a bar that starts and ends on the same day, but the shape cannot be different.
You are not able to represent project dependencies either.
You can inherit colours from conditional formatting, which makes for flexibility, but also additional work and thinking.
You can theoretically go as deep down as you want in the project breakdown, but it isn't ideal. For each level of depth you need an additional column, or do something more complicated with a depth column and conditional formatting based on it. Realistically you will stop at 2, at most 3, levels of depth.
Creating the project timeline with Monday.com

Monday.com is great, you can organise pretty much any work related thing in your boards, and set things up how you like. It's great for tinkerers.
We are not fans of the timeline view though. Clunky is the adjective that most often sprung to mind as we tried to create the project timeline. It took us three attempts before being able to create the project timeline we wanted, and the user interface was sometimes sluggish when adding new tasks or setting the date ranges.
Milestones can be represented, but we cannot track project dependencies.
The breakdown depth is two, or three if you manage to understand how groups can be used in the Timeline view.
Creating the project timeline with ClickUp

ClickUp is a work management tool and a direct competitor to Monday.
The Gantt view in ClickUp is clunky, similarly to Monday, and it has more limitations than the latter. In particular there is no concept of milestones, and we are unable to filter the view to only include the top of the project breakdown hierarchy.
Creating the project plan was a bit frustrating - each interaction taking a bit longer than we would have liked, and on aggregate it took too long.
As with Monday, we get two levels of breakdown. If you need more than that, you may be able to use sub-tasks as a work-around, but they won’t be displayed in the timeline view.
Creating the project timeline with GanttPro

GanttPro is a Gantt chart based project management tool. It also includes task management, offering a Kanban board view.
It has been around a while, given some peculiar user interactions, like the fact that the date zoom levels are fixed. If you switch to the month view, for instance, each month will have a certain width that cannot be changed. That means you are unable to set a zoom level that easily fits the entire project timeline, something that most other tools are able to do.
Creating the project timeline is a smooth process, and it is easy to set date ranges for the tasks either graphically or with calendar controls. The only glitch is in the graphical interface: the elements you can manipulate are quite small, and finding the correct point on the screen to resize the start of a task is quite fiddly.
After Mindiply Timeline, this is the quickest tool for creating the project timeline.
It supports milestones, project dependencies and the project breakdown depth is unlimited.
Creating the project timeline with TeamGantt

TeamGantt is a Gantt chart tool that offers some time-tracking capabilities. It is now expanding into task management, offering a kanban board view. It's a direct competitor to GanttPro.
Creating a project timeline is smooth, once you get used to the way you add tasks and milestones to the hierarchy. The graphical interface for setting the tasks' date ranges is fine, a bit easier than the one offered by GanttPro.
It took about as long as GanttPro to create the project timeline, and the results look very similar.
It can represent both milestones and project dependencies, and the project breakdown depth is unlimited.
Presenting the project timeline
It is unlikely you would present the project timelines as they are to your clients. The three Gantt charts especially - ClickUp, GanttPro and TeamGantt - are too complicated looking to put in front of your clients.
You can probably get away with the other three, especially the Mindiply Timeline and Monday ones, because of how compact they are. It will really depend on how much focus you want to put on the structure of the project.
At the inception of a project, the project timeline is often a best guess based on quick estimates. Once you get into the nitty-gritty of things, you will probably need to revise the project plan. You are still fairly confident in the overall time schedule, because you have done similar projects before and six months was how long they took.
Keeping it simple at this stage is good for both you and the client. From your point of view, you don't create expectations based on a project plan that will definitely change once you start working on it.
From the client point of view they are not focusing on details that are due to change, or exposed to a level of uncertainty that, while natural, can be uncomfortable. They do get a picture of the important stuff - when to expect deliverables they can examine.
So let's assume our objective is to only show the four main phases of the project and the four key milestones. Let's talk about how each project timeline software performed in presenting the project timeline.
Presenting the project timeline with Mindiply Timeline

Filtering the project timeline elements is easy. You have very fine control about what is and isn't shown on the screen. We could not find a way to only show milestones at the top level, though, so in the plan we present to the client we also see milestones below the main phases of the project.
You may also notice that, like most of the other project timeline tools, the names of the milestones are not displayed. The client will probably ask about it though!
Presenting the project timeline with Google Sheets

Filtering elements in Google Sheets was a typical spreadsheet experience: create more columns! With an additional column called Top Elements, we insert 1 in the rows we want to show.
The main critique of the output you get is that milestones and project phases look the same, and you cannot show project dependencies.
We feel that the output is just about enough to be put in front of customers, but just about.
Presenting the project timeline with Monday.com

Getting the filtering we want is a bit tricky. To filter out the second level of the hierarchy you don't use the Filter menu. You go to the settings of the timeline view and uncheck the second level of project breakdown.
We also try to move the milestones on a single row at the top of the project timeline, but that doesn’t seem possible.
The output project timeline is fine - if a bit colourless.
Presenting the project timeline with ClickUp

Does the project timeline look the same as in the previous section? That is correct, because we are not able to filter elements out based on their hierarchy level.
Milestones are not a supported concept either, so like for Google Sheets, we opt to show them as one day tasks.
Of the project timeline tools under review, ClickUp performs the worst on this specific task.
Presenting the project timeline with GanttPro

Filtering to the view we want is done with a single click on the Collapse all button. We can also put all the milestones at the top of the screen, so the output is pretty much what we want.
The only thing missing is the name of the milestones - we couldn't find a way to display them.
Presenting the project timeline with TeamGantt

Filtering to the view we want is done in two clicks - opening the View menu and clicking on Collapse all menu item.
Unfortunately we are not able to create milestones at the same level as the groups of tasks, therefore our output project timeline does not show them.
As a workaround we could create groups that contain only the milestone we want to show, but we feel that that would be too much of a hassle during the project lifetime. If we create the spurious milestone groups, they would look the same as the other project phases.
Preparing for the weekly status report
For this part of the test, we assume that our digital agency has a preferred way to present status to clients, and that we extract the information we need from our project timeline software tool, rather than expect it to create a status report by pressing a button (our user research suggests that this is what happens in most cases in reality).

What we are looking for is:
- Can we find the information we need? Can the information be stored in the project timeline tool?
- Does the timeline tool give other graphs / images we could use in the report that are not part of our template?
Weekly project status report with Mindiply Timeline
Mindiply Timeline provides most of the information we need for a project report from its home screen, where all the projects we have access to are shown:

Mindiply Timeline has also a project status panel within the project timeline screen, with plenty of metrics about our projects.

Some of the information is not what we want to share with our clients - like the fact we need to look for a blog author - but we can decide what to include or not.
The overall percentage is something we have to calculated from the 11/130 days metric though. That feels like an obvious piece of information that should already be there.
The milestones within phases are also not listed, so we have to look at the project timeline to report on them.
Having said that, extracting the information we need is a speedy and painless process.
Weekly project status report with Google Sheets
With Google Sheets you don't get a project dashboard that summarises the status of the project. You need to build that information in the spreadsheet.
Luckily you can get started with someone else's project progress status template.

Calculating total progress is not that hard, if you just create a formula that compares days since the start of the project until today vs days between start and planned end of the project. Definitely not hard to do for adept spreadsheet users.
There is no assistance in determining the overall status of the project - it's your own judgement call. In many cases that will be fine, as long as you are not juggling too many projects at the same time. You could create your own formula to determine the overall status, but to reiterate the point, you're on your own.
In terms of issues and risks, a spreadsheet is the place where most project managers we met during our user research record them.
The next notable dates and milestones can be extracted from either the timeline view, or the tasks table you use to create it.
Finding the information for the weekly report is a bit trickier than with Mindiply Timeline, but after a few iterations it should become a simple chore.
Weekly project status report with Monday.com
With Monday.com you don't get a project dashboard that summarises the status of the project. You need to gather the information yourself.
Like with Google Sheets, having a good template to start with is helpful.
We need some changes to our project board to produce the information we need:
- A new column, called flags, to track issues and risks next to the pieces of work they are related to.
- Another new column, called duration, to estimate the overall progress of the project.

In terms of the overall project status, similar to the situation with Google Sheets, you have to make your own judgement call, there is no suggestion offered by the tool.
For the next important dates and milestones, you look at the project timeline itself, or at the table of tasks. You can also add a binary column that you set to 1 for those tasks and milestones you want to report on, and create a view based on that filtered column. There is a moderate risk of forgetting to keep the column up to date, though.
As with Google Sheets, finding the information for the weekly report is a bit trickier than with Mindiply Timeline, but after a few iterations it should become a simple chore.
Weekly project status report with ClickUp
ClickUp does not offer by default a project status view. You can view reports in the Dashboards section of the app, if you have access to their business subscription.
For our purposes we are able to work around it in a similar fashion to Monday.
We change our space with the addition of two columns:
- Flags, to signal tasks that have issues or risks. We use the comments within a task to write the actual risk or issue.
- Duration, to calculate the number of days in each task, allowing us to estimate the progress percentage of the project.

The overall project status is again your own judgement call, the tool doesn't offer a suggestion. It's possible that with the business subscription some more information is provided though.
The list of next important dates or milestones is again something that needs some digging in the Gantt view or the list view.
As with Google Sheets and Monday, finding the information for the weekly report is a bit trickier than with Mindiply Timeline, but after a few iterations it should become a simple chore.
Weekly project status report with GanttPro
GanttPro doesn't offer a project overview screen. For a project management tool, it feels that it ought to be there.
The overall status of a project can be tracked manually next to the project title, but the tool does not offer an indication on its own.
Tracking tasks with issues or risks can be done using a combination of two fields: comments and priority. GanttPro offers a card view of tasks, and you can group them by priority.
 .
.
Extracting the list of next important dates and milestones can be done in a different view, where we order tasks and milestones by end date.

Getting the information we need for the project weekly report is easy with GanttPro, slower only than with Mindiply Timeline, and not by much either.
Weekly project status report with TeamGantt
With TeamGantt you could get a project health screen - if you subscribe to the most expensive tier of pricing, which starts at $799 per month. If you have enough project managers in your business, that is not a crazy expense. But for smaller businesses that may be a big obstacle.
We will not examine the project health screen in this review, given the price point is way above the other tools we have looked at so far.
The overall status of the project and the progress percentage are not available out of the box, so you need to keep track of them manually. You are able to save them as text notes in the Project settings screen.
To keep track of issues and risks you can use the tasks' Labels and Notes fields.
![]()
Getting the next notable dates and milestones is easy by looking into the tasks list view, similarly to what you can do with GanttPro.
All in all getting the information you need from TeamGantt is about as fast as with GanttPro, and it may be even more convenient if your business subscribes to the (pricey) unlimited version.
Conclusions
Ranking tables
We show two separate ranking tables from two different angles:
- solely as a project timeline software.
- as a project management tool that does both project timelines and task management.
Pricing There are two pricing columns. The first one tells you the minimum yearly cost of the cheapest paid subscription. The second column tells you what the cost per user is. The two columns are necessary because some tools require buying more than a single user subscription.
We normalised the costs for comparison by looking at the yearly cost.
The free tier, when offered, is usually enough for solo project managers.
Pure project timeline tool ranking
| Tool | Free tier | Min Yearly Cost | Price / user | Create timeline rank | Present timeline rank | Status Report rank | Overall rank |
|---|---|---|---|---|---|---|---|
| Mindiply Timeline | ❎ | $150 | $150 | 1 | 2 | 1 | 1 |
| Monday.com | ✅ | $360 | $120 | 4 | 1 | 4 | 2 |
| GanttPro | ❎ | $120 | $120 | 2 | 4 | 3 | 2 |
| TeamGantt | ✅ | $228 | $228 | 3 | 3 | 5 | 4 |
| Google Sheets | ✅ | $60 | $60 | 6 | 5 | 2 | 5 |
| Clickup | ✅ | $150 | $150 | 5 | 6 | 6 | 6 |
Hybrid project timelines / task management tool ranking
| Tool | Free tier | Min Yearly Cost | Price / user | Project timeline rank | Task management rank | Overall rank |
|---|---|---|---|---|---|---|
| Monday.com | ✅ | $360 | $120 | 2 | 1 | 1 |
| GanttPro | ❎ | $120 | $120 | 3 | 3 | 2 |
| Mindiply Timeline | ❎ | $150 | $150 | 1 | 6 | 3 |
| TeamGantt | ✅ | $228 | $228 | 4 | 4 | 4 |
| Clickup | ✅ | $150 | $150 | 6 | 2 | 4 |
| Google Sheets | ✅ | $60 | $60 | 5 | 5 | 6 |
Mindiply Timeline - if your main priority is project timelines
If you already have a solution in place for task management, and are looking for a separate tool to keep track of your project schedule and progress, Mindiply Timeline is a solid choice.
The good
- The project timeline is compact and clear - your client should understand it.
- Quick to create, adjust and extract information from.
The bad
- Milestone names are not shown.
- If you don't like drag&drop, it will feel like a drag.
- It is a specialised tool. It won't do much task management, it won't do resource scheduling, it will only do project timelines and project progress tracking.
The odd
- You cannot hide milestones that belong to project phases.
Google Sheets - if you're happy with a just good enough project timeline
If you feel like the project timeline looks good enough, Google Sheets is a cheap option, and the second quickest method to create a project timeline.
The good
- If you already do project tracking in spreadsheets, this is a natural extension to your existing habits.
- Cheap - who does not have access to Google Sheets?
- Flexible. Missing metric or charts? Create a formula, a graph, import data, ... it's all possible. It's great for tinkerers.
The bad
- If you're not comfortable with spreadsheets, it will take a while to get the output you want. Try to find an existing template.
- The project timeline looks just about ok to put in front of customers.
The odd
- We had to create two columns to represent the two levels of hierarchy in our project breakdown, to allow us grouping them by the highest level of hierarchy. If you want to go deeper in the hierarchy, you will end up doing plenty of copy and paste.
Monday.com - if you already have access to it, you're fine
If you are already using it at work, Monday.com offers you enough to create presentable project timelines, especially if you happen to work on project timelines less than weekly.
If you are not using Monday.com yet, we would not consider it the best tool for project timelines. It would be worth it only if you are also looking for a task/work management tool - thing it excels at.
The good
- If you use Monday.com already, it will probably be good enough for your project timeline needs.
- It allows interacting with the rest of the vast Monday.com ecosystem.
- It allows having day to day task management and longer term project plans in the same application.
The bad
- The timeline looks ok, not great.
- The actual process of creating the timeline can be frustrating at the beginning.
The odd
- Getting to grips about how to recreate a project hierarchy in Monday.com. Do I use groups? Do I use tasks and sub-tasks? It's a try and see what works for you kind of thing.
ClickUp - if you already have access to it, it's a bit clunky but possibly enough
We are not going to compare ClickUp and Monday as work management tools. In terms of project timelines, Monday is the better option.
If you are using ClickUp already, definitely have a go at creating project timelines with it, and see if it is good enough for you and your clients. Especially in the case that your clients are internal stakeholders, they may appreciate you using your existing software portfolio.
If you are not using ClickUp already, we do not consider Clickup a good project timeline tool option.
The good
- If you use ClickUp already, it may be just good enough for you. Money saved!
- It allows interacting with the rest of the ClickUp ecosystem.
- It allows having day to day task management and longer term project plans in the same application.
The bad
- The least capable at producing the output project timeline we wanted.
- The actual process of creating the timeline is frustrating.
The odd
- There is also a Timeline view on offer. We are unable to fit the project date range to the existing size of our web browser, though, and the output is tricky to insert into our reports.

GanttPro - if you love Gantt charts, the best among the tools tested
If you are going to use Gantt charts to manage your projects, GanttPro is a solid choice.
The only thing we will say is that Gantt charts are not necessarily the best timeline charts to share with clients.
GanttPro also offers task management with some Kanban boards support. If you are looking for a tool that combines the both, it could be a worthwhile cost for your business. As a task management tool, though, it cannot be considered in the same league as Monday or ClickUp.
The good
- For experienced project managers who worked with Gantt charts before, it will have a very familiar feel.
- The work breakdown can be as deep as you need to, so it suits more complicated projects.
The bad
- Some of the graphical interactions are fiddly - you need very fine mouse control skills to avoid unintended effects.
- From a project management tool we would expect some graphs and project health metrics out of the box.
The odd
- The zoom level cannot be changed to fit the project to the width available in your browser, you have to determine what looks best by switching between days / weeks / months.
TeamGantt - if you love Gantt charts, and don't mind being unable to show milestones at the top level
If you are going to use Gantt charts to manage your projects, GanttPro is another solid choice.
If we had to choose between GanttPro and TeamGantt, we would pick GanttPro, because it requires less cost to get the same level of functionality.
As with GanttPro you can do task management with list and Kanban views, but we have not explored the functionality in depth. If we were looking for team task management specifically, we would probably rather pick Monday or ClickUp - or Asana, or Trello, or ... there's plenty of choice.
The good
- For experienced project managers who worked with Gantt charts before, it will have a very familiar feel.
- The work breakdown can be as deep as you need to, so it suits more complicated projects.
- The labels field is quite handy to accommodate your own project management style or internal business processes.
The bad
- If you are not on the unlimited tier subscription, you continually get teased about functionality you don't have access to until you upgrade.
- There are project health metrics and charts out of the box - if you are on the most expensive tier.
- You only have day and week views available. Both GanttPro and Mindiply Timeline offer longer term views of months, quarters and years, that are essential for longer term projects.
The odd
- There is a menu item to customise the Gantt view called Skins. We had to spend about five minutes to understand that it changes the way borders in the tasks grid look like.
Related articles


Take advantage of our free 30-day trial to experience the benefits of Mindiply