Free Project Management Report Template
Francesco Marcatto7 Aug 20
Creating effective reports is one of the many duties of every Project Manager. This is, however, a time-consuming activity. Progress reports should:
- Include all the useful information about the progress of the project
- Be easy to understand (remember that while you know every detail of your project, you must communicate it to people who lack your knowledge and expertise)
- Be good-looking (yes, appearances also count).
This is why we have developed an easy-to-use project status report template that you can customise for your next report: you will clearly communicate the progress of your project while saving time.
How to use the Project Management Report Template
The report template is easy to use and we’ll give you some tips to make the best use of it just in case!
Step 1. Copy or download the template for free
So, where do you find the Project Management Report Template?
-
There's a Project template Google Sheets version. Remember that you need to create a copy of it before you’ll be able to edit it with your own data.
-
There's a Project template Excel version.
Step 2. Names and dates
Start by filling out your company’s information and some basic details about the project. By adding the project name, the date and the sequential number of this report you’ll automatically get the report title.
Tip 1: The report will look more professional when you add your company’s logo, so don’t forget it!
Tip 2: The report’s date and sequential number will be especially useful in the future, when you will need to retrieve a specific version of the document.

Step 3. Project Summary
This section will answer the question “How are things going?”. It is the most important information that your clients and stakeholders will be looking for. Use the standard RAG (Red-Amber-Green) colour code to indicate the status at-a-glance. Red means that there are some serious issues or delays, amber means that you recognise some problems, but they don’t affect seriously the progress of the project, green means everything is ok.

Tip 3: Anticipate clients’ and stakeholders’ questions by explaining the red issues in the comment section.
Tip 3a: If your project is in serious trouble, and you need to inform your clients and stakeholders, you may want to have a look at our article about how to deliver bad news when managing a project.
Step 4. Project Completion
Add the start date, the baseline end date (that is, the original deadline, forecasted when planning the project) and the expected end date (the updated forecast). The difference between the original and the expected date will be automatically calculated (variance).
Tip 4: The project completion percentage is another very important information clients and stakeholders will look at, in order to understand if the project is on track.

Step 5. Budget
This is easy: add the original budget and the expenses so far, so you’ll automatically get the budget left .
Tip 5: Add a comment explaining if you are under or over budget, this is another piece of information clients and stakeholder will surely need.

Step 6. Milestones and Issues
Finish the report with two lists. In the first one, add all the critical milestones with their due dates and flag the ones which are already completed. This way, you’ll communicate progress. Add a comment to every missed or delayed deadline.
In the second list, add all the problems which caused or are still causing delays, blocks, or unexpected expenses. Qualify their status (open, investigating, solved, etc.) and write in the action plan column how you plan to manage them.

Tip 6: If you have developed a Gantt chart, add it here. It will provide a visual timeline representing the project activities over time.

Bottom Line
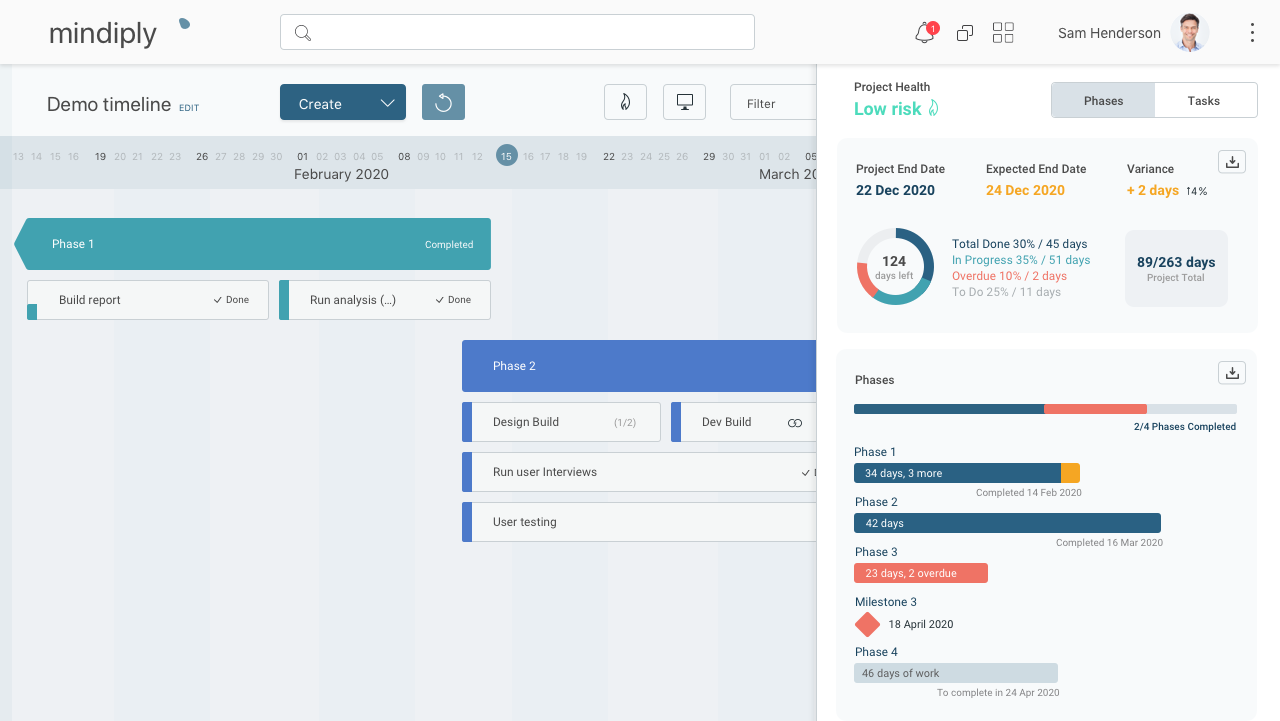
This template is an easy way to quickly create an effective report to show progress and updates to your team, clients, and stakeholders. Of course, you can easily edit it to suit your own needs, and if you are looking for a more powerful tool to automatically create project management status reports, try for free Mindiply Timeline, the smart online tool for planning, managing, presenting & reporting projects of every size.


