Blog
Login
Services
Bespoke software
Products
Timeline
Decido
Staff competencies
Blog
Login
About
Careers
Contact
x
Tips backed by science for your work life
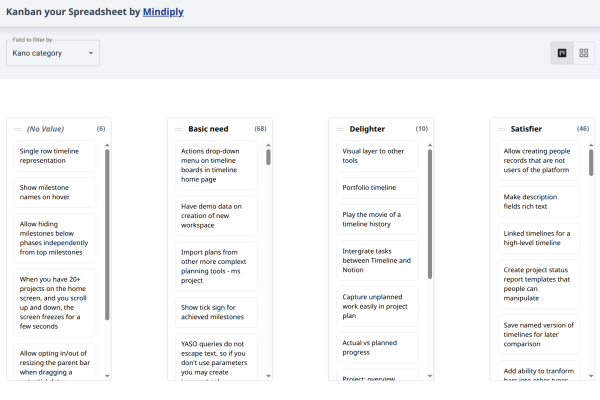
Kanban Your Spreadsheet
Paolo Bongiovanni
4 Feb 26
Manage your spreadsheet data on a Kanban board
4 useful decision-making techniques from the audiobook Decisive
Paolo Bongiovanni
22 Dec 23
Widen your options with multitrack, change perspective with 10x10x10, and prepare for the worst with tripwires
Gantt chart alternatives by reason for change and attributes to keep
Paolo Bongiovanni
14 Nov 23
Whether you need something similar but simpler than Gantt charts, better project monitoring or task management, there should be an option for you
Best project timeline software for 2024 road tested
Paolo Bongiovanni
20 Oct 23
How six project timeline tools fare against our customer's digital strategy project
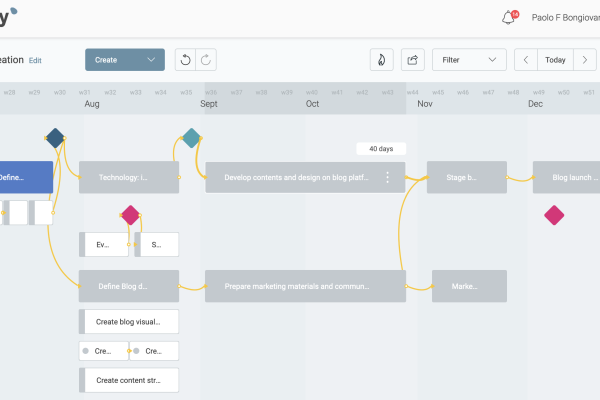
How to read a project timeline in Mindiply Timeline
Paolo Bongiovanni
6 Jul 23
The when, how and who of a project?
Behind the scenes of Mindiply Timeline Episode 3: How to Measure a Project?
Francesco Marcatto
21 Jun 21
Metrics and Timelines
Don't want to miss an article?
Subscribe to our newsletter
Load more
Take advantage of our free 30-day trial to experience the benefits of Mindiply
Start trial
By signing up you accept our
terms of use
and
privacy policy
© 2016 - 2026 Mindiply Ltd. All rights reserved
COMPANY
Blog
About
Careers
Contact us
PRODUCTS AND SERVICES
Bespoke software
Timeline
Staff competencies
Decido
LEGAL
Privacy
Terms of Use
SOCIAL
Subscribe to our newsletter