

Behind the scenes of Mindiply Timeline Episode 3: How to Measure a Project?
Francesco Marcatto21 Jun 21
In this third article about the making of Mindiply Timelines, the forthcoming Project Management tool from Mindiply, we’ll talk about numbers, metrics, and everything you need to know to measure (and manage!) a project.
Metrics and Projects
If you can’t measure it, you can’t improve it. Peter Drucker
If it does not have a number, it is not a Key Result. Marissa Mayer
Well, I’m not a big fan of quotes. There are so many quotes out there, you can always find something to justify also weird ideas. But this time it’s different. Quantitative measurement is a hallmark of the scientific method, and it’s key for project management too.
You need numbers when you plan a project. How long will it take to complete Phase 1? How much will it cost to redesign the website? Project forecasting is both art and science, and, while estimates are likely to be more optimistic than reality, it will create a sort of a baseline you should follow in an ideal world. And yes, you need hard numbers, even when the temptation to just say “it will take a long time” is very strong.
You need numbers during the progress of the project. In the last two weeks, how many tasks of Phase 1 have been completed? How many days are left before Activity 4 ends? One of the many duties of a PM is to constantly check that things are going as planned, and to periodically update stakeholders and/or clients, and metrics are the core of project progress monitoring.
But you need numbers also to estimate what will happen next, based on how things have been so far. Since we completed just 30% of Phase 1 tasks in the last 4 weeks, will we be able to finish everything in the next 3 weeks or should we hire some new people to help us? Constantly monitoring progress, indeed, is more than just keeping stakeholders quiet, it’s fundamental for discovering problems (obstacles, roadblocks, call them what you want) before it’s too late and there is still time to act.
Metrics and Timelines
Ok, it is clear now that if you can’t measure it, you can’t manage it. Following this mantra, we developed Mindiply Timeline around the idea of project measurement. The objective was to provide PMs with all the metrics they would ever need and to make them immediately visible, so they don’t have to navigate through many menus and options to get what they need.
Timelines naturally display the expected duration of phases and activities, but we decided to go further and display also the percentage of completion and the number of tasks completed/total.
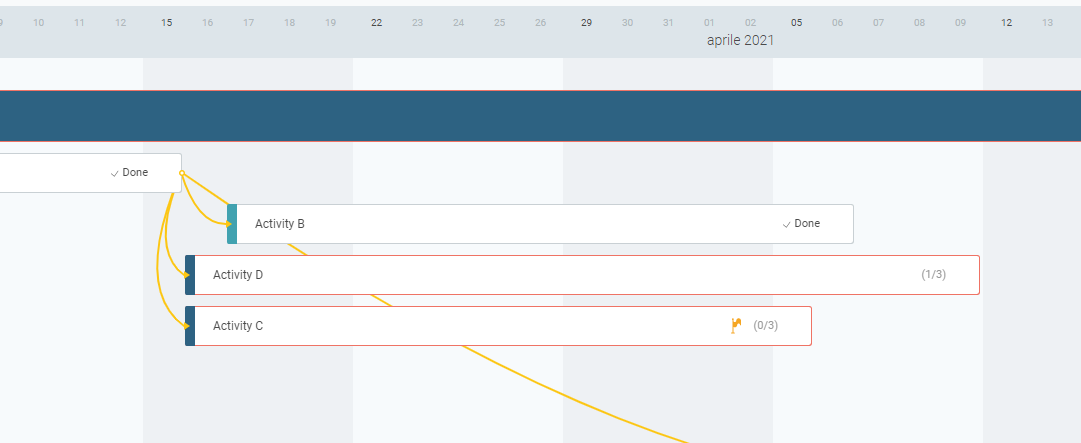
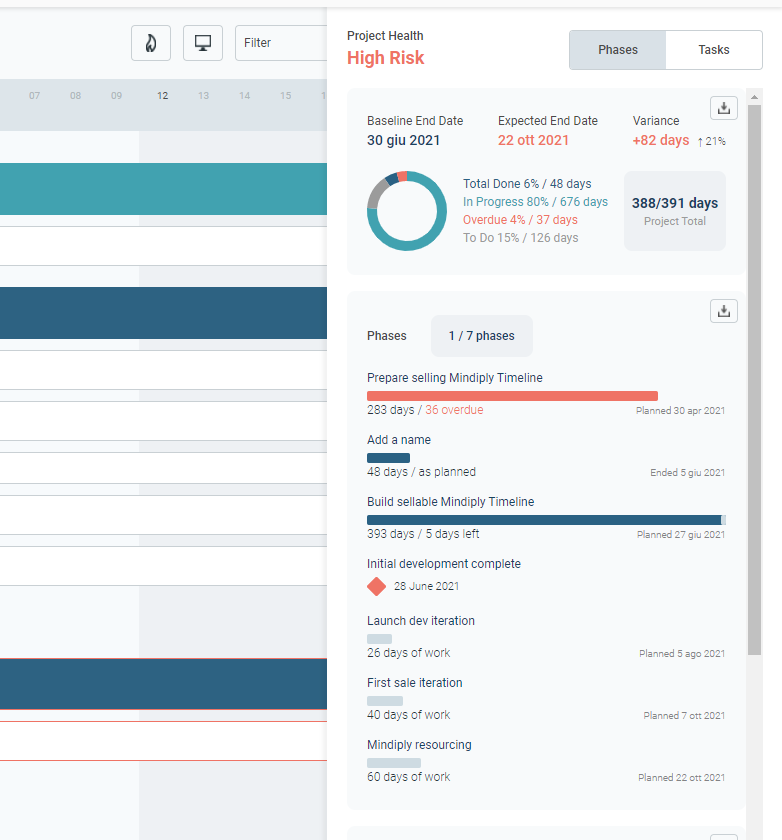
This way, you immediately get what has been done so far and how much is left to do before the deadline. But this is just the tip of the iceberg. Click on the “fire” icon, and you’ll open a panel with all the metrics you need to properly manage a project: Overall progress percentage (including overdue elements), the expected end date (and the baseline end date, of course), the progress of each phase (so you can understand exactly what is causing troubles), and the overall health of the project.
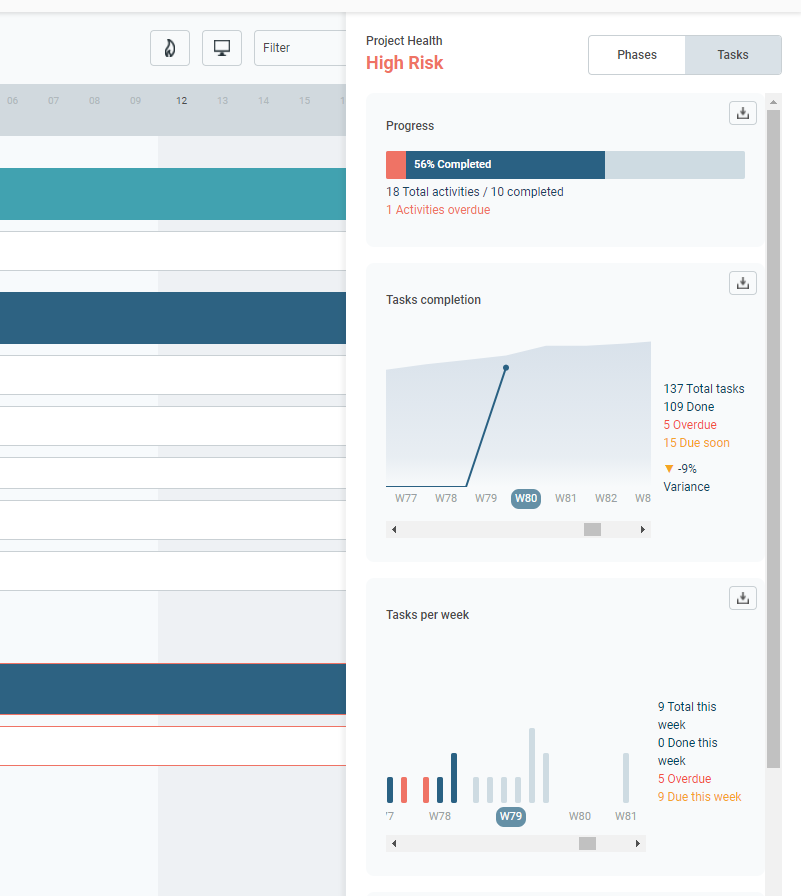
Still want more? Click on tasks to switch to a more granular level and see the progress and estimates of task completion. Metrics, estimates, and warnings are automatically calculated and you can see them with a click, there’s no need to go crazy with spreadsheets or complicated menus.
Mindiply Timeline is available now, you can just sign up to the 30-day free trial!
A final note: the title of this article is inspired by How to measure a planet?, the masterpiece of the Dutch rock band The Gathering, one of my favourite albums ever.
Cover picture by Freepik
Related articles


Take advantage of our free 30-day trial to experience the benefits of Mindiply