


Powerful project management & reporting software 
Plan, manage & estimate successfully
Why our SaaS tool is different


Deliver within scope & budget restrictions
Respond quickly to unforeseen changes
Keep your clients happy & increase business
Make decisions based on real time data
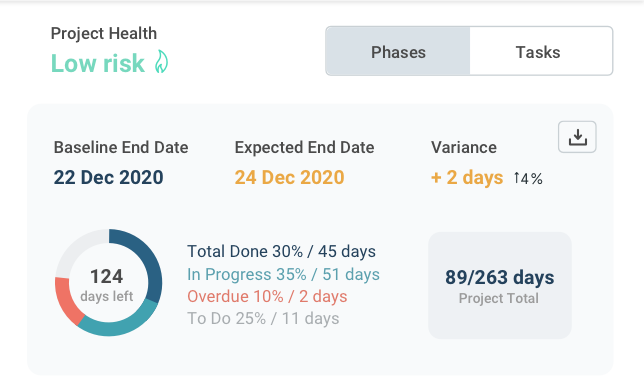
Get professional- quality visual reports fast
Are you using clunky project management tools that people cannot understand? Generate highest quality visual reports in real-time with just one click. The perfect companion to your status reports.

Track your team’s performance seamlessly
Align your team and task tracking with your timeline progress. Stop updating different project management tools manually and cut time from your admin duties.

Communicate clearly with your clients
A simpler alternative to a Gantt chart that non-PMs can understand.
What is behind 

How to create the perfect Project Status Report – Guide and Checklist
Learn how to create a functional status report that facilitates progress and keeps everyone informed.

Smart Gantt charts: the secret pm weapon
This modern way of presenting your project will make it easy for everyone to get what’s to be done and by when.

How to communicate project status to clients and stakeholders
Let’s go straight to the point: if you use minutes or spreadsheets, you’re doing it wrong. Really, really wrong.
Want to see the timeline app in action? Sign Up Today
© 2016 - 2026 Mindiply Ltd. All rights reserved


COMPANY
PRODUCTS AND SERVICES
LEGAL