

Smart Gantt charts: the PM secret weapon
Francesco Marcatto21 Feb 20
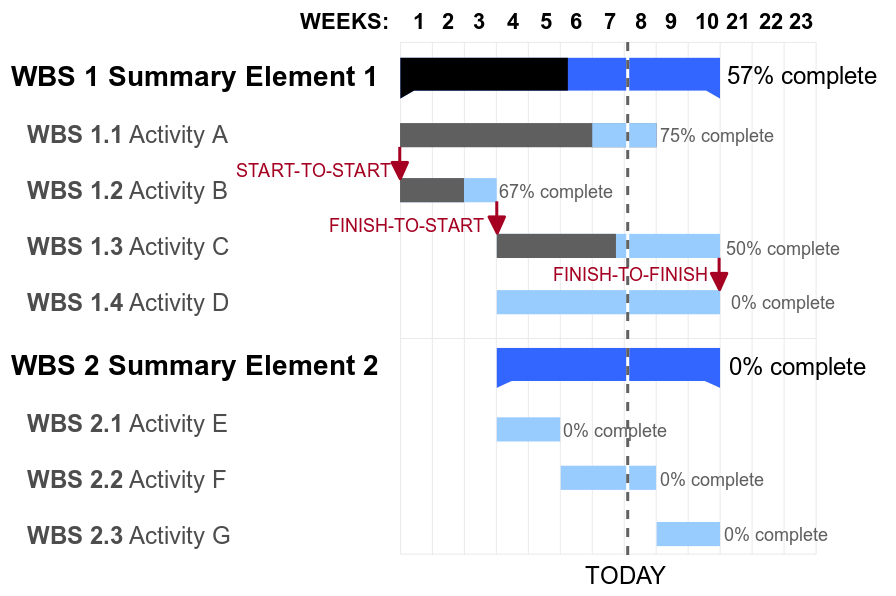
Gantt charts are very popular in project management. With a Gantt chart, you can visually display the schedule of your project: through horizontal bar graphs, you see when tasks should begin and when they are expected to be finished.
This way of representing a sequence of tasks is extremely natural and effective: we think in pictures, and we naturally represent numbers and time in a mental number line/mental time line (think of it as a kind of horizontal ruler, where time flows from the left to the right).
The main benefit of using a timeline in project management is that it will make it easy for everyone to understand what’s to be done and by when. Another major benefit is that it will force you to think and plan a sequence of steps for completing the project. Breaking down a big goal into smaller components brings clarity, increases motivation, and makes everything more actionable. You know, divide and conquer.
What’s wrong with traditional Gantt charts
Not everything that glitters is gold. Gantt charts nowadays are often seen as an old-fashioned, vintage project management tool. Indeed, there are some good reasons to believe that traditional Gantt charts, like the ones you can make with classic spreadsheet software, have some serious limitations.
Four main issues have been pointed out by Dr. Harvey Maylor in a research paper suitably called Beyond the Gantt chart: Project management moving on.
The first is the low flexibility. Accurate planning requires a high degree of certainty in time estimates to be useful, however, we are usually not very good in time forecasting (it’s a well-known bias called planning fallacy), so we should expect errors, especially in medium and long-term planning. But when a forecasting error occurs, or you just need to adjust some starting or ending dates, this cascades on all the subsequent tasks and makes updating the Gantt chart a nightmare.
Second, there is no 'why'. You see a chart with a plan but you don’t see why such planning is carried out. There is just a sequence of tasks, but people won’t know from the chart the reason behind the whole project and the specific tasks.
Third, it encourages a one-step approach to planning. Modern project planning is seen as an iterative activity, but when people see the nice, coloured chart, they think it can’t be wrong, so they are unwilling to challenge it, even when they should.
Fourth, being a project-manager tool, they reinforce the idea that the PM is the only one responsible for the time-plan. In other words, traditional Gantt charts encourage the already control-addicted PM to over control the project, instead of devolving or sharing the responsibility.
Improved Gantt charts for better project management
Most of the problems presented above are not intrinsic to the Gantt charts, they are more due to the way they are usually created. For many years, Gantt charts have been created first by using the good old pen&paper combo, and later by using spreadsheet software, which can create nice charts but are a pain to design and to update!
As you can easily imagine, it is quite hard to update a paper Gantt chart (even one created with a spreadsheet), as it is adding more content in the bars. Nowadays, new technology can overcome most of the problems of traditional Gantt charts, and make them again useful for modern project management.
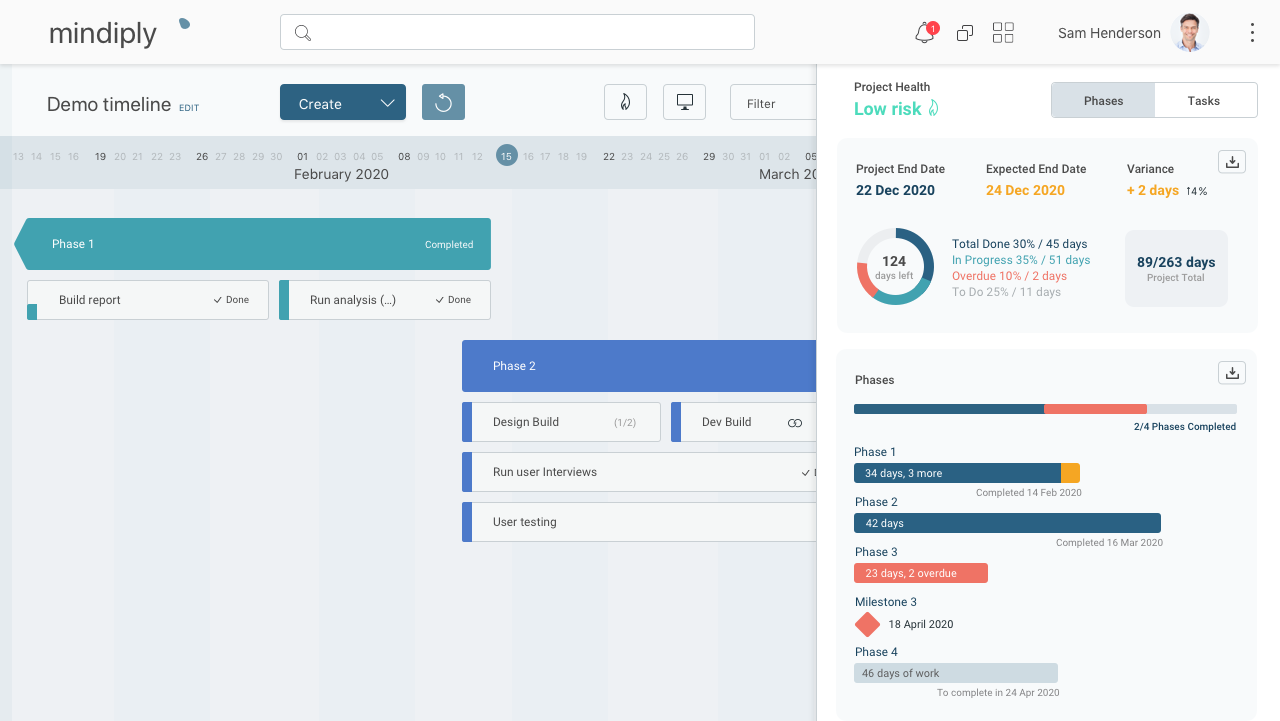
Here’s how Mindiply Timeline, the smart online tool for Timeline Project Management, has brought new life to Gantt charts.
Flexibility
Using a Gantt chart to plan your project has been considered as one of the deadly sins of project management. Indeed, Henry Gantt didn’t create the chart that brings his name for the sake of planning, but rather to display and communicate an already developed schedule.
It is also true, however, that many PMs like to start planning already in the timeline. They love the possibility to instantly see how their plan is developing, but the rigidity and clumsiness of many tools make it a nightmare. Need to extend the duration of activity A? Sure, but you’ll have to change the starting and ending dates of activities B, C and D. Yikes!
Mindiply Timelines instead has been built around the idea of flexibility. You can start planning immediately, just click and create a new activity, adjust its length with drag and drop, and see immediately how it fits the overall project. And when you need to adjust something, just do it, it’s fast and natural. The less time you spend on the tool, the more time you have for bringing your project forward.
From Roadmaps to Task-level timelines
Traditionally, different kinds of timelines charts should be used depending on whether you have to plan your high-level strategy or your tactics. Indeed, there are tools for creating high-level roadmaps and other tools for information-dense Gantt charts.
But why can’t you use a single tool to create both? And what about everything in between these two extremes (see also this article)?
Mindiply Timelines is the answer. You decide the level of granularity and detail you need.
Say that you have to show your stakeholder the strategy for the next semester, you can stay at the high-level and plot a roadmap displaying just the big chunks of work you plan to do in the next six months.
You can also go down to the nitty-gritty level and tell your team members exactly what they have to do to execute the strategy. So break down those big chunks into smaller activities and assign them to their owner.
Dynamic collaboration and smart tracking system
Usually, you’re not alone in working on the project, and a project manager is also very often a team manager too.
Mindiply Times makes teamwork easy. Invite your team members to collaborate with you in real-time, so they can update the progress of their activities. Edits will be automatically saved with full visibility of changes and you will get automated notifications when things are not going according to plan or when a team member wants to notify you about a roadblock ahead.
So, to recap: real-time collaboration and tracking of progress, and a smart alert system so you’ll never miss a deadline and your projects will be delivered on time.
Mindiply Timelines: An agile and smart tool for Timeline Project Management
You can fly high and plan out your strategy, then come down to the tactical level and define the activities which will make you and your teams fulfil your goals.
And since we all know that no plan will ever survive contact with the enemy, when it will be time to update your plan or to totally redo it, you’ll be able to do it in just a couple of clicks.
Say goodbye to micromanagement, project management can be finally a team process: Invite your teammates to the board, plan and decide together activities and key results. You’ll always know what your team is doing, and everyone can be responsible and update their own progress. Motivation and engagement are higher when you use a participative approach, this is one of the main takeaways from the Goal-Setting Theory and Management By Objectives framework.
Now that you know the benefits of planning by using modern Gantt charts, you can start planning for success using Mindiply Timeline.
Related articles


Take advantage of our free 30-day trial to experience the benefits of Mindiply